Security telemetry is mostly noise. Thousands of connection events per hour, per device, across dozens of apps — a wall of numbers that looks random until you change the lens.
We changed the lens. What came back wasn't random at all.
The Device That Just Moved
Earlier today, a workstation was migrated into a new organisation. Within minutes of the move, it started emitting access telemetry under the new org. We pulled that data: 1,651 permit events across a 297-minute window.
To the naked eye it looks like normal workstation traffic. Edge browser, svchost, Slack, OneDrive, VS Code. Nothing alarming.
But when you stop asking what connected and start asking when — the picture changes.
What Frequency Analysis Finds
We ran a Fast Fourier Transform on the per-minute event count series. FFT converts a time-domain signal (events per minute over time) into a frequency-domain representation — revealing which periodic patterns are hidden inside the apparent noise.
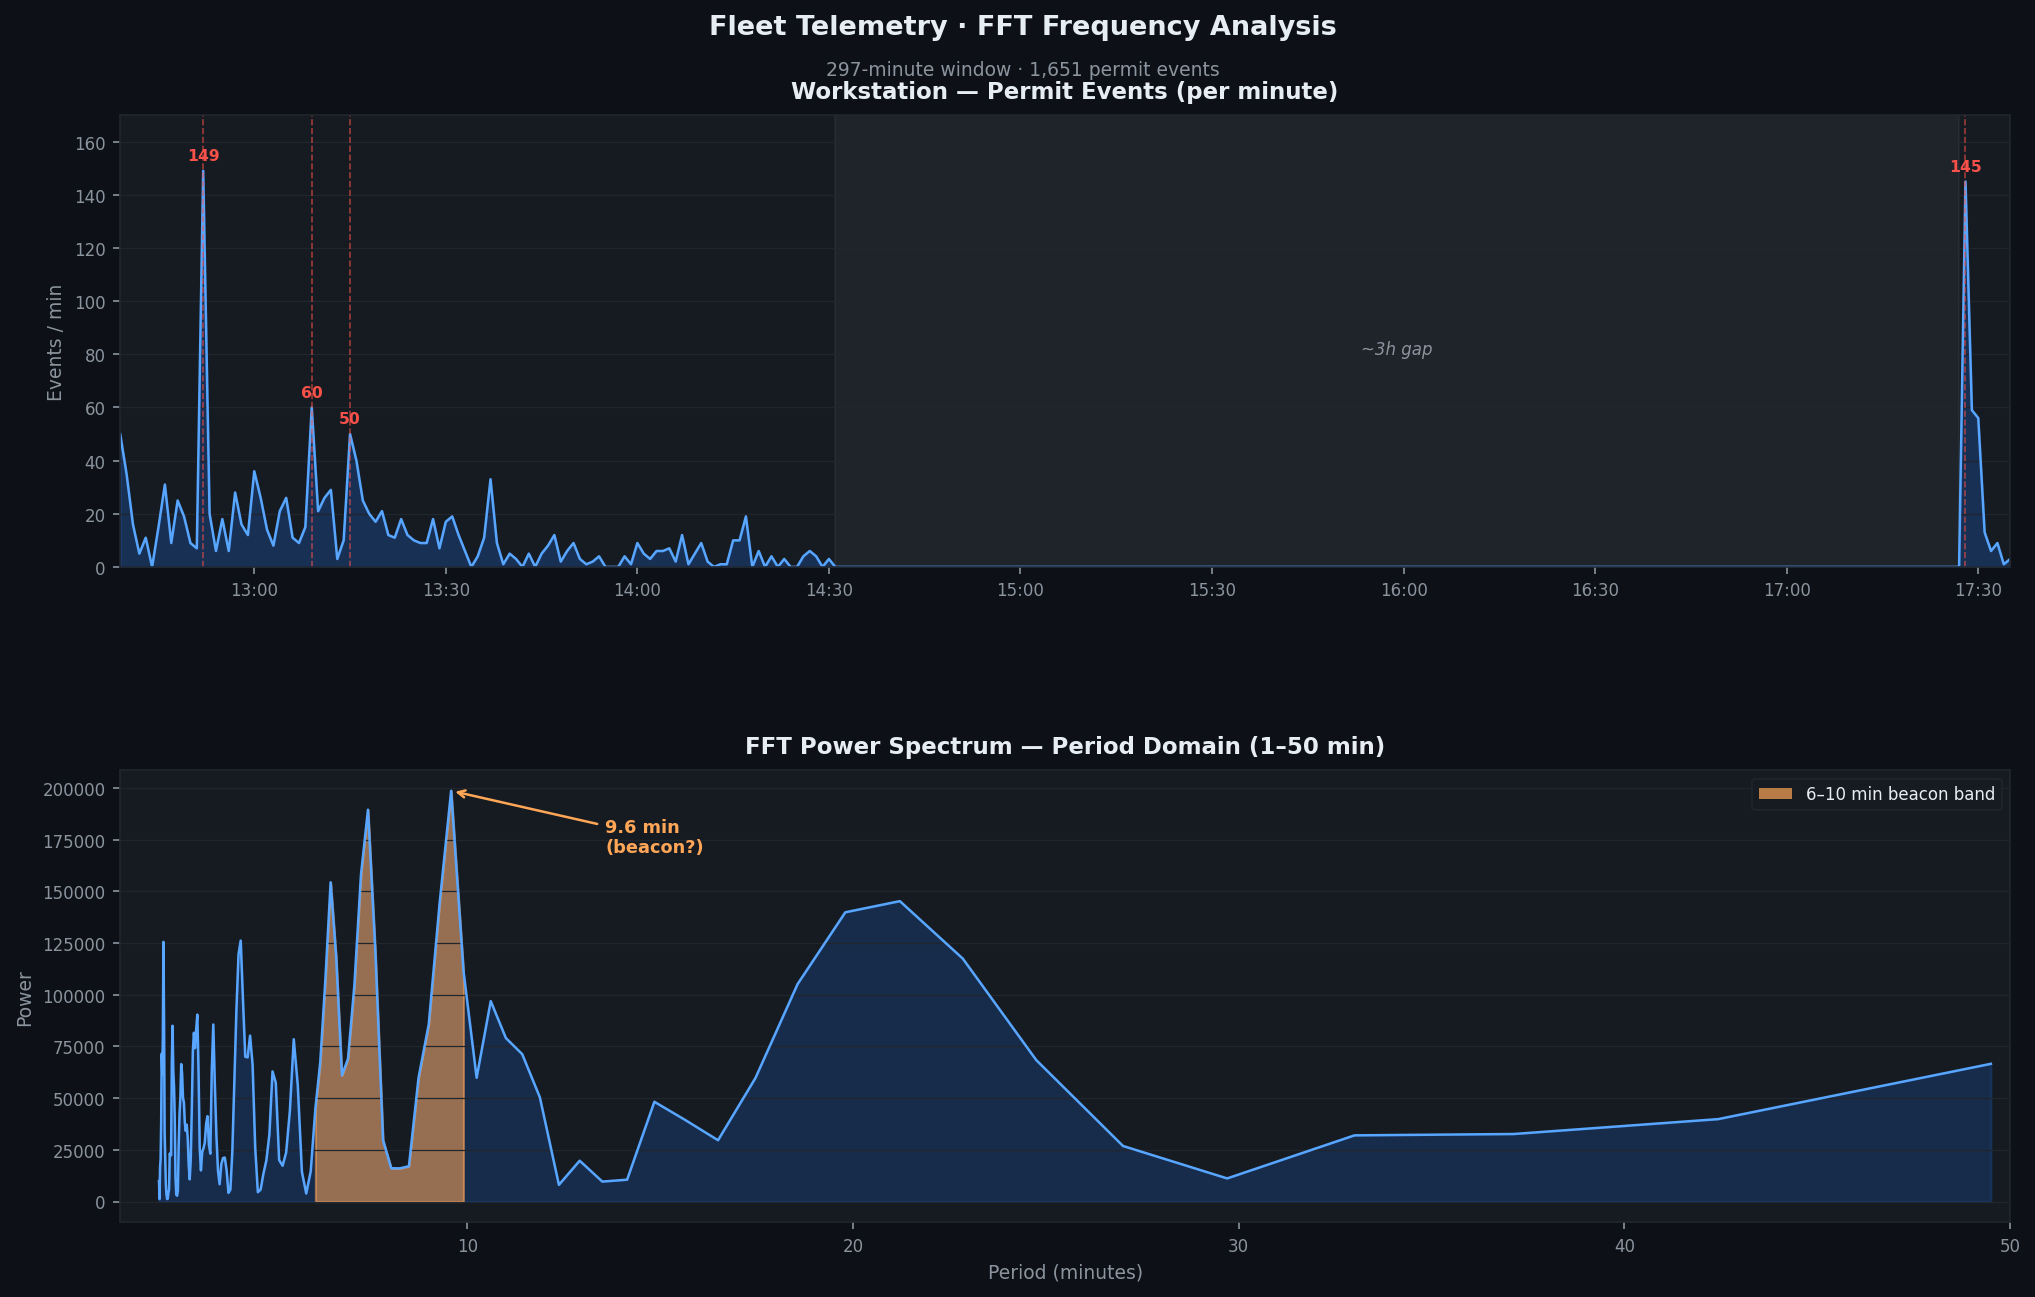
The top panel is the raw time series. Three sharp spikes in the first two hours — 149 events at 12:52, 60 at 13:09, 50 at 13:15 — then a quiet period, then a large burst of 145 events at 17:28 when the device reconnected post-migration.
The bottom panel is where it gets interesting.
The 6–10 minute beacon band (highlighted in amber) carries strong, concentrated power. The dominant peak sits at 9.6 minutes. That's not random. Random noise distributes power broadly across all frequencies. A sharp peak at a specific period means something is firing on a schedule — and 9.6 minutes is not a human schedule.
What a 9.6-Minute Period Actually Means
Human-driven activity is irregular. You open a browser, you browse, you close it. The gaps between actions vary. The FFT of human-driven traffic looks like broadband noise — power spread evenly across the spectrum.
Scheduled activity is different. A process that phones home every 9.6 minutes produces a spike at exactly that frequency, regardless of what else is happening on the machine. It's a clock signal inside the noise floor.
What runs on a clock?
- Keepalive beacons — C2 implants checking in to confirm the host is alive and awaiting instruction
- Polling agents — legitimate tools (MDM, telemetry collectors, update services) that check for new work on a fixed interval
- Data staging — exfiltration tools that batch and transmit on a timer to blend with normal traffic
- Scheduled tasks — Windows Task Scheduler jobs firing at a configured interval
The 9.6-minute figure narrows the field considerably. Standard Windows update and telemetry services run on 15-minute, 30-minute, or hourly intervals. Sub-10-minute periodicity with this power density is unusual enough to warrant identification.
Bigger Than One Device
One device is a data point. A fleet is a dataset.
Run FFT across every device in your estate and the picture scales dramatically:
For apps — an application that beacons every N minutes will produce the same frequency signature on every host it's installed on. If 12 devices all show a peak at 7.2 minutes and that peak correlates with the same executable path, you've identified a fleet-wide behaviour from a single frequency pattern. No log parsing, no alert rule, no prior knowledge of the threat required.
For users — user behaviour has a natural cadence. When that cadence breaks — an account that normally shows broad-spectrum activity suddenly develops a sharp periodic signal at 3am — you're looking at either automation or compromise. FFT makes the anomaly visible without needing to define what "normal" looks like in advance.
For threats — advanced persistent threats specifically engineer their C2 intervals to look like noise. Jitter is added to avoid exact-integer-minute patterns. But jitter doesn't eliminate the fundamental frequency — it broadens the peak. FFT still finds it. The peak just has a slightly wider skirt. A human analyst looking at raw logs would never see it. The transform does.
The Gap Is Information Too
Notice the ~3-hour silence in the time series (14:30 to 17:28). That's not a network problem — it's the device between sessions. When it reconnected at 17:28, 145 events fired in a single minute as buffered connections flushed and services re-established.
That reconnection burst is itself a frequency signature: a large transient followed by return to the 9.6-minute baseline. It's consistent with a keepalive process that queued its missed check-ins and flushed them on reconnect.
The gap tells us the process was running the whole time. It just had nowhere to send traffic.
What We Do With This
The 9.6-minute signal on this device is under active investigation. The next step is identifying which application maps to that cadence — cross-referencing the FFT peaks against per-application event timestamps to isolate the process responsible.
If it's a legitimate agent (IncrediBuild coordinator, OneDrive sync service, an MDM heartbeat) — it gets catalogued, baselined, and monitored. If it deviates from its baseline cadence in future, that deviation is itself a signal.
If it's not a legitimate agent — that's a different conversation.
This is the value of treating your telemetry as a signal rather than a log. Logs tell you what happened. Signals tell you what's happening — and what's going to happen next, if you know how to read the frequency.
Threatmatic captures full flow log and device access telemetry across your enrolled fleet. Frequency analysis, behavioral baselining, and anomaly detection run continuously — so the signal inside your noise doesn't stay hidden.