Every customer evaluating inline HTTPS inspection eventually asks the same question, in one form or another: will this slow anything down? It's a fair question — decrypting, classifying, and re-encrypting traffic inline is real work, and "trust us, it's fine" isn't an answer a security team can act on. This piece covers ZeroProbe™, a small, deliberately narrow feature that answers it with actual numbers instead of a promise, and — more interesting than the feature itself — why it needed almost no new code to build.
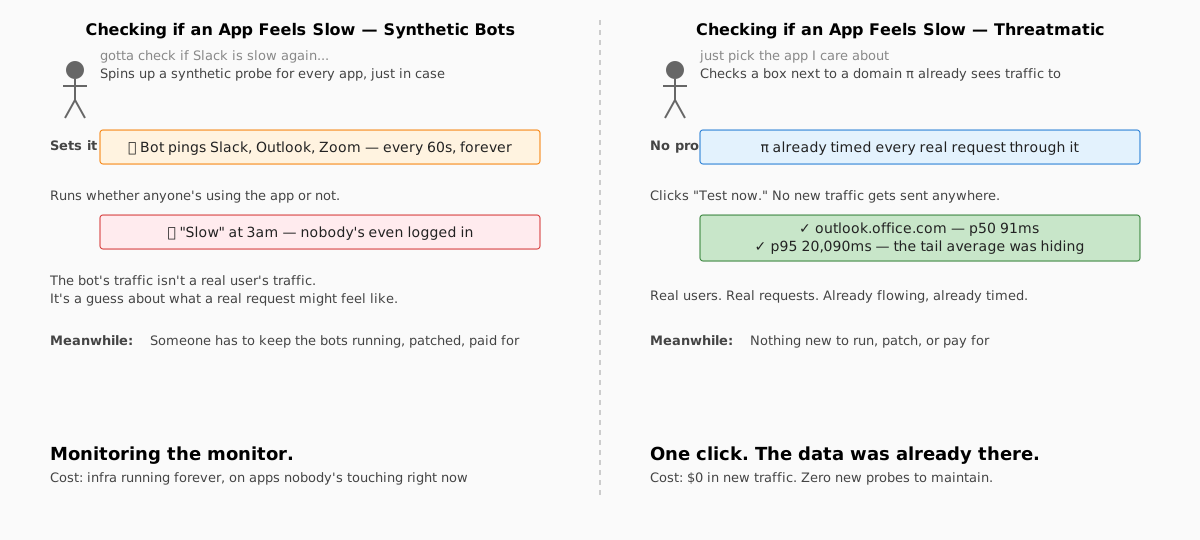
The data was already there
π classifies every HTTP(S) flow that passes through it: host, path, method, status code, an entropy
score, a threat classification — and, less loudly, how long the whole round trip took. That last
field, durationMs, gets computed on every single request whether or not anyone ever asked for it:
now := time.Now()
durationMs := now.Sub(data.startTime).Milliseconds()
It's been flowing end-to-end since before this feature existed — from the pi agent, over its own
gRPC metrics stream to the engine, through a message queue, into a payload_inspection_events row —
purely as a side effect of π doing its actual job. Pull it from a live database today and it already
tells a real story. Here's what π has already measured, this week, for two apps almost every
customer runs:
| host | requests | p50 | p95 | error rate |
|---|---|---|---|---|
outlook.office.com | 663 | 91ms | 20,090ms | 17.0% |
api.github.com | 760 | 218ms | 547ms | 10.8% |
Look at that outlook.office.com row. The median request is fine — 91ms, nobody notices. The 95th
percentile is twenty seconds. An average, or even a p50 alone, would have hidden that completely.
That gap between "looks fine" and "the tail is brutal" is exactly the kind of thing a security team
gets blamed for after the fact, and exactly the kind of thing they currently have no way to check
before someone complains.
Why passive, not synthetic
The obvious way to answer "will this slow things down" is to build synthetic checks — deploy probes that ping each app on a schedule and watch the response times. It's the standard playbook, and it's also the wrong shape for this problem:
- It's not real traffic. A bot hitting a login page at 3am measures a bot hitting a login page at 3am, not what an actual user experienced during business hours.
- It's infrastructure that runs forever, on apps nobody may be actively using right now, whether or not anyone ever looks at the results.
- It duplicates data π already has. Every field a synthetic probe would measure — latency, status code — π already computes on every real request, for free, as a byproduct of inspecting it.
So the design constraint was simple: no new probes, no new agent-side instrumentation, no new traffic
sent anywhere. Just a different lens on data that's already streaming. "Test now" doesn't trigger
anything — it queries the last few minutes of payload_inspection_events, fresh, the moment someone
asks.
Surgical, not blanket
Turning this on for every host an org has ever talked to would just be a second version of the noisy π Inspection dashboard that already exists — more numbers, not more insight. The actual feature is narrower and more deliberate: an org picks the specific apps it wants watched, and only those apps get the rollup.
The picker itself is the detail that makes this usable rather than theoretical. The obvious version —
type in the domains you want monitored — has the same problem blockedDomains/allowedDomains
already have: it asks an admin to know, from memory, every hostname a modern SaaS app actually uses
(Slack alone spans several). Instead, the picker is populated from hosts π has already observed
for that org. Check a box next to outlook.office.com because π has already told you traffic goes
there — don't type it and hope you got it right.
That's the whole mechanism: one opt-in list of hosts, one rollup query scoped to exactly those hosts, a button that re-runs it fresh. Precise because it's scoped to what someone actually chose to watch — not a blanket "monitor everything" that buries the one app that matters under twenty that don't.
Where to find it
This is live, not a proposal. Head to π Config → ZeroProbe™, check off the hosts you want watched — picked from traffic π has already seen, not typed from memory — and save. Then open π Inspection, where a new ZeroProbe™ card rolls up p50/p95 latency and error rate for exactly the hosts you opted in, with a Test now button that re-runs the query on the spot.
Nothing here required touching the agent, the engine, or the gRPC pipeline that carries this data today — the entire surface is new schema and a query in the console, because the hard part — actually collecting the numbers, in production, on every real request — was already solved before this feature was ever scoped.
Threatmatic. threatmatic.ai